Alright, this is the part I always get excited about when it comes to trips — the numbers. What did we actually do, how much did it cost, and what did a normal day look like? Let’s break it down.
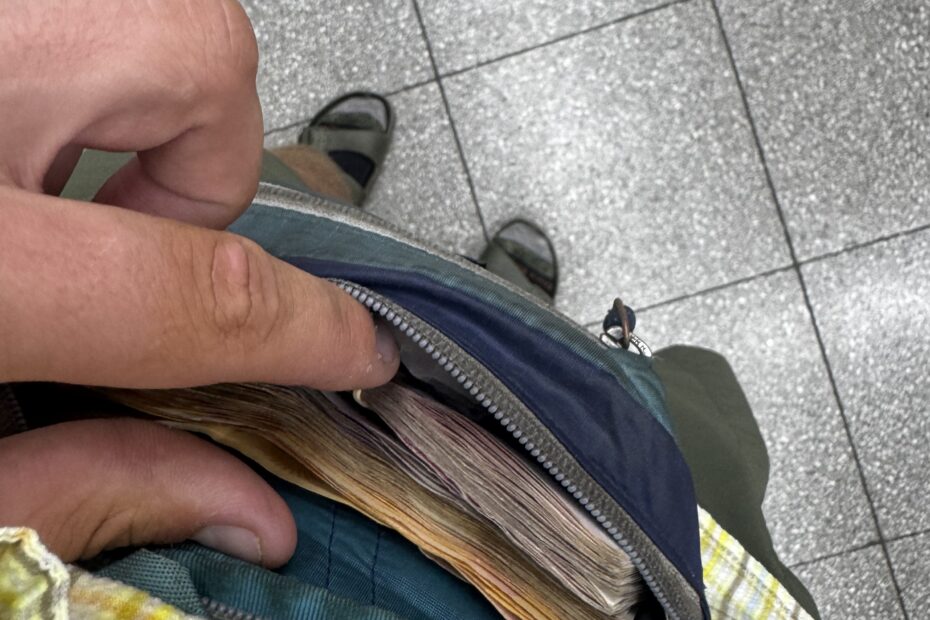
Money spent
Since 2016, I’ve kept a simple habit: I manually log every expense. It helps me understand where I stand financially and how I actually live and travel. Naturally, I did the same for this trip. Some costs were split with Phil, so there was a bit of back-and-forth and minor confusion, but I’m confident about 95% of this is accurate.
Overall 136 days on the road — let’s take a look.
Over 4.5 months in South America, I spent $5,600 / €4,800, averaging
$41 per day / €35 per day. So… where did the money go?
Food & drinks — $3,100 / €2,670 (66% of the total)
Everything food-related: groceries, eating out, snacks, coffee, beers — all of it.
That’s roughly $23 per day / €20 per day.
I was eating a lot, and I loved it.
Accommodation — $620 / €530 (11% of the total)
63 nights total, mostly in northern South America — Colombia, Ecuador, Peru, Bolivia — where prices are low.
The most expensive night was $19 / €16, an Airbnb in Bogotá right after landing.
Gear & replacements — $420 / €360 (7.5% of the total)
Some of this was pure self-inflicted damage:
- New bike crank: $50 / €43
- New pedals: $30 / €26
- Switching to proper tubeless tyres: $150 / €130
- Full bike clean: $50 / €43
- New spoke, wheel retaping, sealant: $37 / €32
Lessons were learned.
Transport — $370 / €320
Taxis to and from airports, three long-distance buses (plus bike fees and tips), ferries, and small transfers.
Honestly, this category ended up much higher than expected.
Insurance — $280 / €240
W Trek – Patagonia — $268 / €231
Three days in Chilean Patagonia, fully self-organized and done on a budget. No guides, no refugios — just camping and logistics.
- Park entry: $36 / €31
- Camping (3 nights): $64 / €56
- Transport (bus + catamaran + shuttle): $70 / €60
- Backpack rental: $39 / €34
- Food: $59 / €51
For context, many people spend $1,000–1,500 for the same trek by staying in refugios or joining guided tours. Doing it independently keeps costs low — at the price of more planning and carrying your own gear. With a guide, the price roughly doubles.
Entertainment & experiences — $210 / €180
Two major highlights in Bolivia:
- 3-day Salar de Uyuni & lagunas tour: $120 / €105
- Huayna Potosí (6,088 m) climb, 2 days: $90 / €75
Gear, food, logistics, and tips included — highly recommended at least once in your life.
Other expenses — $145 / €125
Random but unavoidable things: gifts, barber, postcards, gear rentals, shipping boxes, and small odds and ends.
Permits — $90 / €80
Phone plans — $55 / €50
Local SIM cards across all the countries we visited.
These costs don’t include flights, which can be expensive — I spent €1,700 in total for both ways: Lithuania to Bogotá with the bike €800, and Patagonia back to Lithuania with the bike €900.
Distance covered, time moving, elevation gain
They say bike touring is 90% mental and the other 10% is also mental. But after 88 days of grinding through South America, I realized my legs were keeping a much more literal receipt. I’ve been tracking every kilometer, every vertical meter.
Total Distance: 7,010km. The Lithuanian Metric: Aukštojas Hill is 294 meters high. My total distance is roughly 23,844 times the height of the tallest point in Lithuania. To match this distance, you’d have to hike up and down Aukštojas every single day for the next 65 years lol.
Total Vertical Climb: 80,948 meters. The Comparison: We’ve climbed the equivalent of Mount Everest 9.1 times from sea level with 30kg bikes.
Total Time Moving: 389.1 hours (23,343 minutes). You could watch the entire series of Breaking Bad (every single episode) nearly 8 times back-to-back.
The Daily Rhythm
Across all 88 recorded riding days, our “standard” day in the saddle settled into a very specific rhythm. We typically covered 80 km while climbing an average of 920 meters, a combination that demanded a consistent effort of 4 hours and 25 minutes of active moving time.
Navigating the Mileage
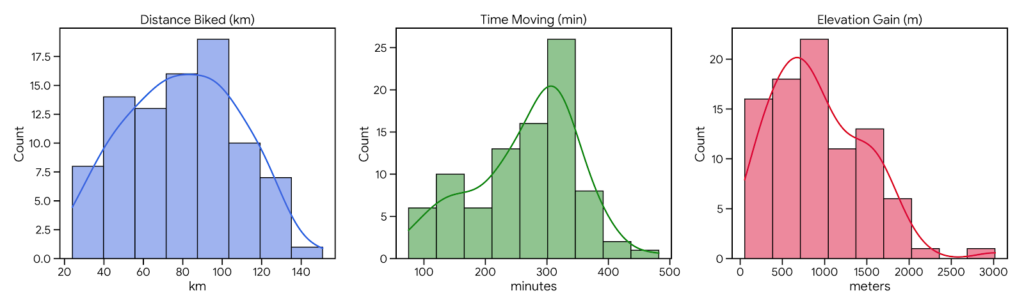
The distribution of our distance shows a massive range that mirrored the shifting landscape of the continent. While we pushed ourselves to a peak of 150.9 km during a long sprint in Argentina, the high-intensity climbs often slowed us down to a minimum of just 24 km in a single day. Despite these extremes, we found our most sustainable pace stayed remarkably consistent between 60 and 100 km, regardless of which country we were crossing.
The Discipline of Time
Time spent moving was perhaps our most disciplined metric. Even as the road surface and elevation fluctuated wildly, our actual time spent active remained incredibly stable. We averaged 265 minutes of effort per day, generally putting in a solid 4 to 6-hour “work day” whether we were flying across flat plains or grinding up a mountain. It is important to note that this is purely riding time; because our tracking devices pause the moment we stop, a typical day actually meant we were out on the bike for at least 1 to 2 hours longer before reaching our final rest stop. Our absolute longest push in a single day topped out at roughly 7.5 hours of continuous, recorded movement.
The Vertical Grind
The elevation data reveals the true skeletal structure of the trip, showing a relentless upward trend that defined our physical experience. While we averaged 920 meters of climbing per day, the range was staggering—from a “flat” recovery day of just 55 meters to an absolute monster of a day where we peaked at 3,017 meters of vertical gain. Despite these massive outliers, our most common days involved grinding through 750 to 950 meters of elevation. This constant vertical movement meant that even on days where the mileage was low, the physical workload remained intense, as we were effectively climbing a mountain’s worth of altitude nearly every single day we were on the road.
The Vertical Trade-Off
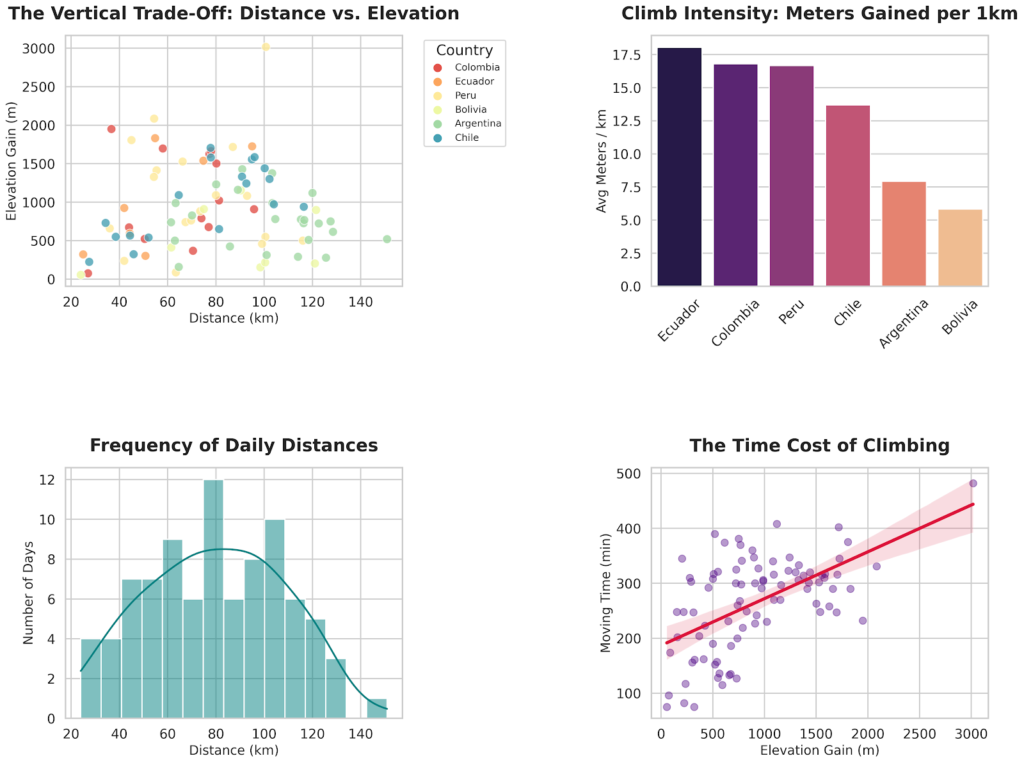
We found that the relationship between distance and elevation gain was the most telling part of our data. Rather than a “paradox,” it was a brutal trade-off: the more we had to climb, the less distance we could cover. Mathematically, the correlation between the two was almost zero (r = 0.05), which is the statistical way of saying these two metrics were often at war. In the mountains of Peru, we would spend an entire day fighting for a mere 40 km, while the flatter stretches of Argentina allowed us to easily triple that mileage. This confirms that in the Andes, your daily progress isn’t measured in kilometers, but in the vertical cost of the terrain.
Measuring Climb Intensity
To truly understand the “grit” required for each country, we looked at climb intensity—the average number of meters gained for every single kilometer traveled. This revealed a clear hierarchy of suffering, with Ecuador sitting at the top, demanding an average of 18 meters of climbing for every single kilometer we moved. However, those numbers don’t tell the whole story; because we were mostly on paved roads in Ecuador, the effort felt manageable despite the steepness. Peru and Colombia followed closely in intensity, but the experience in Peru was on another level of difficulty. In Peru, almost all of those vertical meters were earned on intense gravel roads, making the “cost” of each meter feel significantly higher. It wasn’t until our transition into Bolivia and Argentina that this intensity finally dropped, allowing us to trade the vertical struggle for horizontal speed.
The Frequency of Our Effort
When we look at the frequency of our daily distances, a clear “sweet spot” emerges. Despite the extreme variety in terrain, we most frequently settled into a range of 60 to 100 km per day. The distribution shows that while we had several “epic” outliers where we pushed toward 150 km, and a few vertical grinds that kept us under 30 km, our bodies and the daylight hours naturally gravitated toward that mid-range distance as our standard unit of progress across the continent.
The Time Cost of Climbing
Gravity acts as a heavy tax on our pace, and the data shows a direct correlation between elevation gain and the time we spent in the saddle. Every extra meter of climbing added a predictable chunk of time to our day, regardless of the distance covered. This metric is a reminder that the mountains didn’t just drain our energy; they drained our clock. On big climbing days, our average speed would plummet, turning what looked like a “short” day on paper into a grueling sun-up to sun-down battle against the incline.